| Table 4. Global, latitudinal and regional methane emissions | 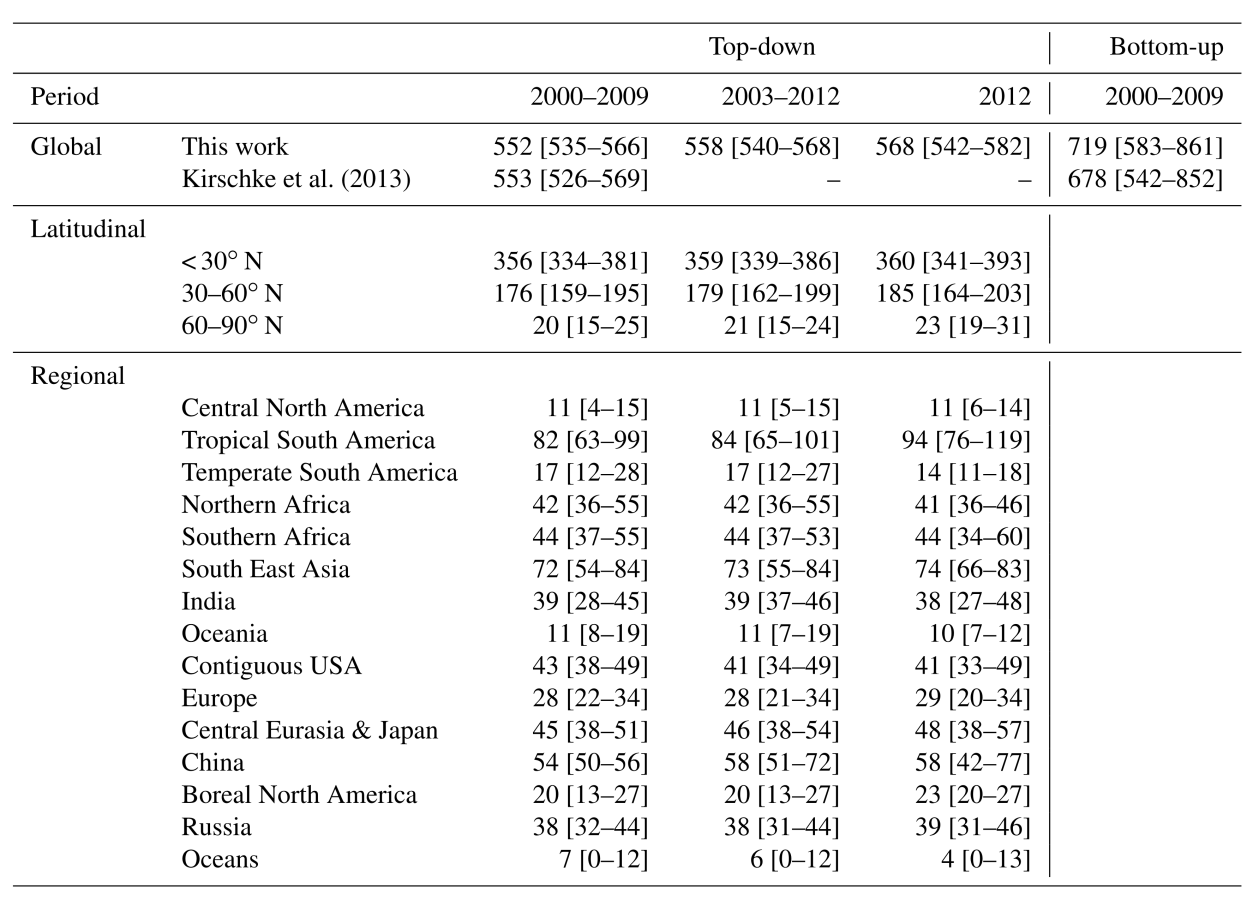
Table 4. Global, latitudinal and regional methane emissions in Tg CH4 yr-1, as decadal means (2000–2009 and 2003–2012) and for the year 2012, for this work using top-down inversions. Global emissions are also compared with Kirschke et al. (2013) for top-down and bottom-up for 2000–2009. Uncertainties are reported as [min–max] range of reported studies. Differences of 1 Tg CH4 yr-1 in the totals can
occur due to rounding errors | | | Source: Earth System Science Data | URL: http://www.earth-syst-sci-data.net/8/697/2016/essd-8-697-2016.pdf
(The text for the image(s) on this Web page was taken from the above source.) |
|